The age-old problem that teachers face daily is also a key challenge for brands and their agencies. Media research tends to measure and report on whether an advert had the opportunity to be seen, rather than measure whether it actually was seen. Most agencies focus on the former rather than the latter as that’s the trading currency the markets use to price media.
As performance specialists, we at The Kite Factory have an unfair advantage: We use response, interaction, and transaction data as a proxy for attention, giving us real-time feedback on what messages were seen and acted on. That said, when we find a valuable new insight, we act on it.
Lumen Research published a very useful paper just before Christmas, exploring how much attention consumers pay to advertising and if attention varies by media channel. They used eyeball tracking from TVision for TV, and their own eye-tracking technology for other screens (calculation rules and methods in figure one below).
Of the impressions claimed by a media owner, they asked how many could be seen (as the screen on); how many were seen (were you in the room); and finally, how much of the message did you watch?
1. Lumen methodology
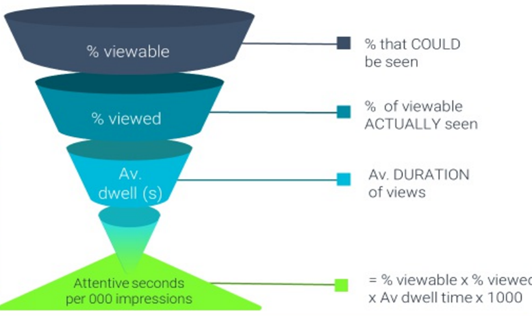
Source: WARC 2021
Not surprisingly, they found a vast difference between media channels (see figure two below). VOD performed best for both viewability and actual viewing – mainly because it tends to be short-form ads, they aren’t skippable and viewers want the content that follows the ads. TV came in second, with approximately 70% of viewers in the room and 40% paying attention.
The results from social are a real artifact of our age and the age of the core users. Social recorded a lower viewability than actual viewing because an ad has to be on screen for more than two seconds to be recorded as viewed, despite consumers being able to scroll through their feeds, note an ad, and move on in less than this. If ever we needed evidence of mass ADHD, then surely this is it!
2. Percentage of ads by channel that are viewable and viewed
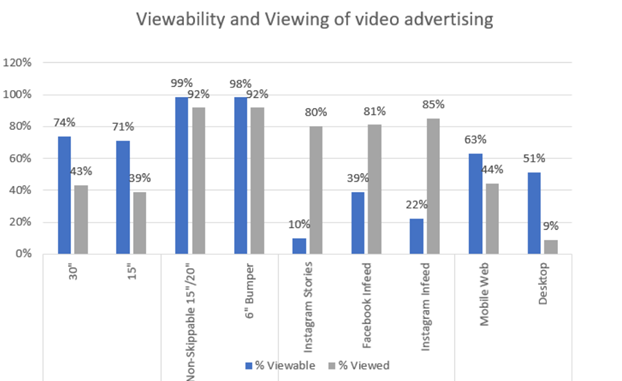
Source: WARC 2021
The attention equation’s final element is the amount of time each piece of creative is viewed for. As seen in figure three below, TV clearly wins by a country mile. Around 1/3 of a 30-second ad and half a 15-second ad are viewed (NB. this research was carried out in the USA).
3. Average dwell time viewing per ad per channel
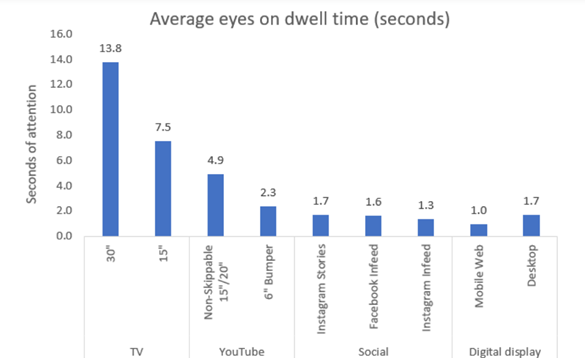
Source: WARC 2021
This reinforces our prejudices, and while it quantifies the differences between channels, it doesn’t add much to the interaction and transaction data we already have. The real actionable insight however, is that we can apply the attention calculation to the price of each channel. E.g., take an ‘average’ all adult CPM for each video channel, and apply the attention factor to it. We then have a new media price: the Attention Cost per thousand. The price charged as a CPT by the channel, essentially increased if there is less attention and dwell time or decreased if there is more (see figure four, below).
4. Relative cost per 1,000 attentive seconds for all adults by video channel
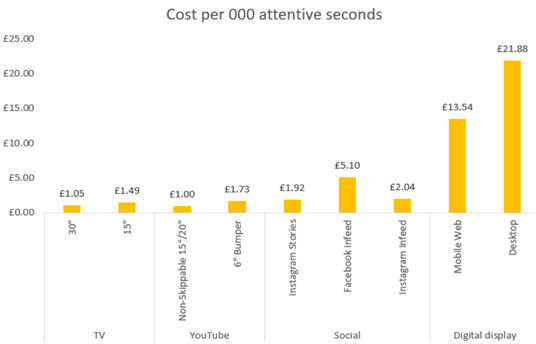
Source: WARC 2021
In summary, this study reminds us of three lessons: Firstly, that big screen in your living room corner is not a dinosaur and very much not dead yet. Secondly, YouTube is under-priced at the top of the funnel (but weak at the bottom). Thirdly, social and display need to be data-driven and bought efficiently. And finally, your social and display ads need to be relevant to the individual, as you have only have a few seconds to grab someone’s attention. That means that you may only have one TV ad per campaign, but for optimal performance you should have multiple display and social versions
To find out more about what this means for your brand, get in touch with the team.