House prices this month rose by around 10% compared with May last year. Used cars cost 21% more than in April 2020. The UN tells us that global food prices are 40% ahead of this time last year, and don’t get me started on the price of a pint since the pubs reopened! But none of this is seemingly currently relevant in media land. The talk has been of demand returning to 2019 levels, and possibly, driven by TV, OOH, and radio, inflation at c3% this year.
All of this started me thinking about media inflation over the long term.
In the four decades that I have worked in media, UK ad spend has risen from just under £4 billion in 1982 to just over £25 billion in 2020. That’s a six-fold increase in demand and almost double the 360% growth in CPI that the Bank of England records for the same period.
Now, I have spent most of my forty years focusing on delivering effective outcomes, rather than outputs for our clients, and I haven’t seen effectiveness fall during that time. Rather I have seen it improve for many clients, partly due to better data and understanding of what drives effectiveness. Much of it however has been due to supply growing faster than demand. Put simply, the number of eyeballs available to advertisers has grown faster than the pounds chasing them.
We have seen growth in each and every channel
The 1980s saw the explosion of print as the Apple Mac enabled editing and production on a desktop. The 1990s brought the advent of satellite and cable and billions more impacts. On a smaller scale, it also brought more screens to cinema with the birth of multiplexes. The noughties saw more than 500,000 new OOH sites created, even on the back of toilet doors. And of course, 95% of us acquired a computer and a mobile phone. By 2013 we were spending more time each day with media than asleep. By 2016- see figure one below, we were cramming 10 hours and 52 minutes of media consumption into just 8 hours and 45 minutes each day.
Figure one: media stacking came of age in 2016
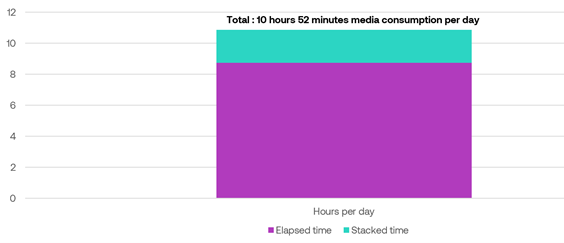 Source: Ofcom CMR 2016
Figure two: those minutes have continued to grow in the last five years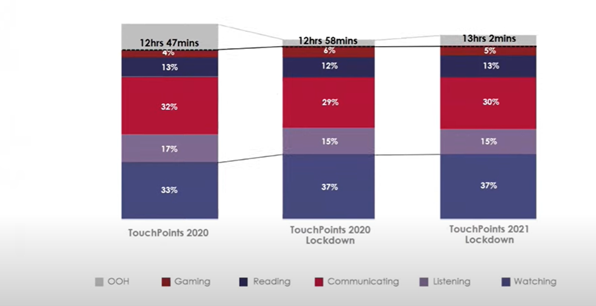 Source: IPA Touchpoints
The Touchpoints data, published last month, shows that our daily hours consuming media have continued to grow. Much of this is now “stacked” with the dual screening of TV and phones; phones and OOH when travelling; radio and computers when working or gaming, and numerous other daily examples.
During these last decades, supply has not grown evenly, and each channel has had its place in the sun. The 1990’s saw peak television and steady growth of OOH, while internet access reached 75% by 2010. Smartphones only appeared at the end of that decade, but the revenue rapidly followed the eyeballs, as figure three below shows.
“The internet” accounted for only 0.1% of UK ad revenue in 1997. By 2019 that had reached 61%, growing at an average of some 3% points each year. In 2020 the growth rate more than doubled- adding 8% points to touch 70% of all ad revenue.
Figure three: revenue has followed supply: as a result keeping aggregate CPM’s low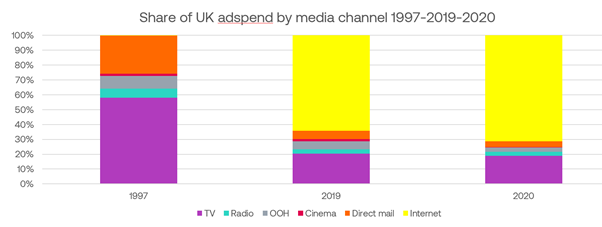 Source: AA/WARC UK advertising expenditure reports 1997-2020
So far, so good. No one minds more demand as long as supply keeps up and aggregate prices don’t rise. It’s when there is a shortage (think chips and PS5) that we all get grumpy.
We may have run out of road in the growth of supply of eyeballs. Our forty-year growth in the supply of advertising impressions for UK advertisers to buy may be about to come to an abrupt halt. In fact, we may be facing the prospect of a perfect storm.
Television is facing two threats: The first is the long-term trend in decline of mass viewing. TV still delivers more reach and dwell time than any other channel, but the scale of audience to any one “big” programme has declined markedly in the last decade. As a consequence, the supply of eyeballs as impressions has fallen by 17% since 2011.
Figure four: commercial impacts have declined 17% in the last decade
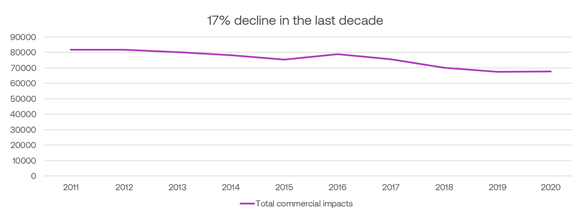 Source: Barb
This trend will be accelerated and exacerbated by the adoption of subscription (and ad-free) TV channels. Netflix, Amazon, Disney+ were all big winners in the last year and continue to be so in 2021.
Print is heading for extinction: Ad revenues to printed newspapers and magazines fell by 35% in 2020, and the sector stopped publishing its circulation figures. We see this as an extinction event and the eventual loss of all eyeballs in this channel.
OOH is back, but in the wrong place: We are all emerging back out of our homes and into the outside world. Mobility is now at c75% of that pre-lockdown, and trends suggest that we’ll be out and about more this summer than in 2019. But posters are (mostly) static. And they were built and sited for where we used to go, not for where we go now. Travel on public transport is still down by c40%, and we spend 40% less time in aggregate in workplaces. With the trend to flexible working, neither of these will recover soon.
Radio has been impacted by the loss of the commute: Whilst Radio listening increased throughout the pandemic, targeting and maximising the buy has become more challenging. The morning and evening peak travel and listen are gone. And unlikely to come back to the same scale.
Which leaves us with “the internet”: The recent headline from Ofcom stating that we spent three hours and 37 minutes online last year neglects to mention that this represents just an extra nine minutes gain in a lockdown year. That’s a limited amount of additional advertising supply, especially as the primary growth was in shopping, not browsing. Google search is not providing any help. Search volumes are basically static- 5.8bn each day in 2018 and some 5.4bn in 2020.
The major concern is the threat to the ubiquitous “long tail” display inventory.
In the days of third-party cookies, any mum and pop site can offer the same audience as a leading media owner. Why pay £8cpm to the Guardian when that same reader can be bought ten minutes later for just £0.80 or less? With the advent of IOS14, rollout of consent management platforms and the coming moves from Google, the granularity of insight into audiences online already diminished could drop off a cliff in early 2022.
Unless the competition commission or other industry bodies intervene smaller websites will be unable to monetise their inventory at the same levels. Budgets will then flow to larger wall garden sites or to traditional offline media owners who have leveraged their brands and depth of content to gain consumer zero- and first-party data both of which will cause price inflation.
Navigating to avoid this potential “perfect storm”.
The last few decades in media have offered performance-focused advertisers looking for price and value advantage numerous opportunities to invest in effectiveness via value intelligently. There is a significant risk that value will be harder to find and require more flexibility and more commitment to partners in the future.
As yet, this topic is generating little public debate in the market. However, we have been pondering the challenge and have several solutions that will help value focussed advertisers secure price advantages in the coming years. For more information, please get in touch.
By Mike Colling, Founder of The Kite Factory