A year can pass quickly, especially in the media marketplace. Just 12 months ago the bravest of our clients were enjoying half price TV advertising, the first time we’ve seen prices fall that far in, well, ever. Fast forward a year and demand is up, viewing levels are declining as we leave our lounges for real life, and prices are beginning to approach those of 2019. So how can performance-led advertisers mitigate the impact of this inevitable inflation on their costs per acquisition?
A Cost Per Customer calculation is comprised of two elements: The media costs one pays and the number of customers generated for that cost. If the costs are rising, then the number of customers needs to rise too. But how do you generate more response from a fixed (or falling) bucket of impacts?
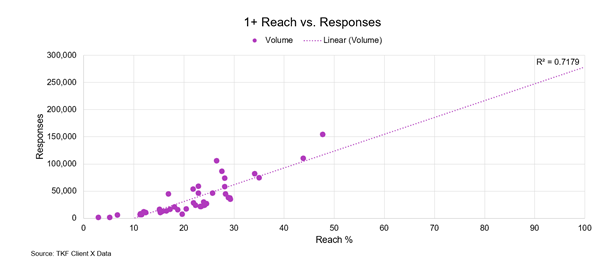
One tried and tested method for driving up response is to focus on reach. For pure performance clients, i.e., those who are trying to harvest response from those customers in market, or those who have a simple task of generating awareness and immediately triggering response, typically in a low concern or short decision period category, the highest response rate will come from those consumers seeing an ad for the first time that month.
Figure one below illustrates this nicely. For one of our clients, we plotted 1+ reach on a weekly basis vs response volumes. The results speak for themselves.
The new eyeballs from a viewer seeing an ad for the first time generate more response
The antithesis also holds true: The more often we show a DRTV ad to the same viewers the lower the response rate falls.
Figure two, below, shows the response rate for another client, plotted this time against the cumulative number of times the ad had been seen. As cumulative viewings rise so does frequency, as we run out of new viewers to find in anyone month. And as frequency rises response rate falls as the chart illustrates.
Figure two: As frequency of exposure rises response rate falls
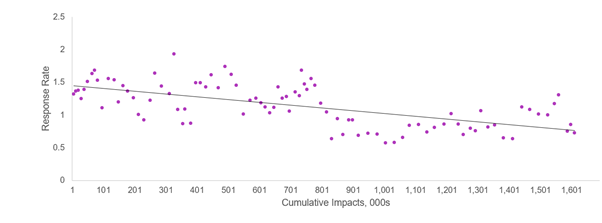
Source: TKF Client Y
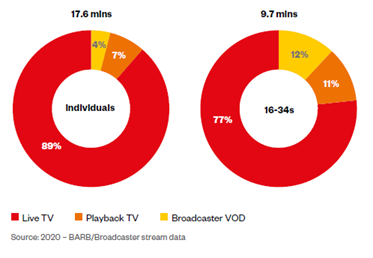
So far, so good. But where can we find these illusive new eyeballs? Much is talked about the role of online video, and YouTube in particular. Unfortunately, whilst YouTube accounts for about 13% of our total viewing minutes per day (much more amongst the younger audience) as figure three below shows, it only delivers 5.6% of all video advertising minutes in a typical day for a typical adult.
Figure two: The viewing day in 2020-time spent with channels carrying advertising
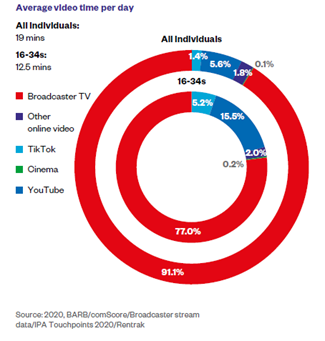
Broadcaster-supplied TV channels still supply 91% of all adults advertising minutes in 2020, and even 77% amongst the under 34’s. Unfortunately, not all of us watch the same amount of television, nor see the same amount of advertising and this hasn’t changed. It has however become more pronounced during the last five years, as figure three below demonstrates.
Figure three: 8 million of us see fewer than 50 ads a week, and 8.3 million see none (on linear TV)
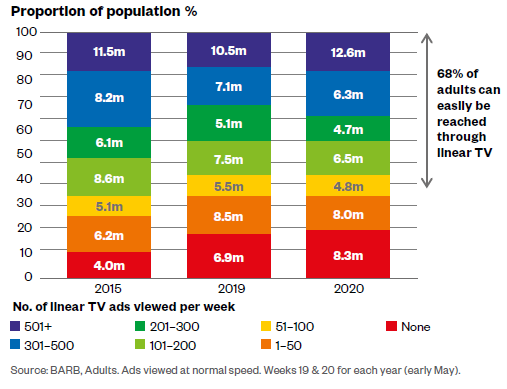
So, the heaviest viewing 2/3rds of us can be reasonably easily reached with an adequate budget and a sensible airtime selection. But when you reach the point of diminishing returns, which can happen quite quickly with a sustained DRTV investment, where do you find those elusive light viewers, new eyeballs, and more response?
The surprising answer is BVOD (Broadcaster Video On Demand). Think Box sets, binge viewing, and finding the show that all your mates are talking about. On the face of it BVOD is still the runt of the litter, accounting for only 4% of the daily viewing or 17 minutes for a typical adult, and even less for an under 34-year-old.
Figure four: BVOD is dwarfed by live TV viewing
But despite the fact that BVOD is the seventeen-minute weakling, it punches way above its weight in incremental reach terms, and our last chart shows why.
Thanks to some very nifty analysis by Thinkbox (a perfect nickable chart, so we nicked it), figure five below, shows that two thirds of BVOD viewing is consumed by the lightest half of linear TV viewers. If you look back to figure three above, you’ll see that the lightest half of TV viewers see only 75 or fewer ads a week. If you are a typical DRTV advertiser, the chances of one of those being yours are slim, but in the happy hunting grounds of BVOD they are much higher.
Figure five: the lightest 50% of linear TV viewers account for 65% of BVOD viewing
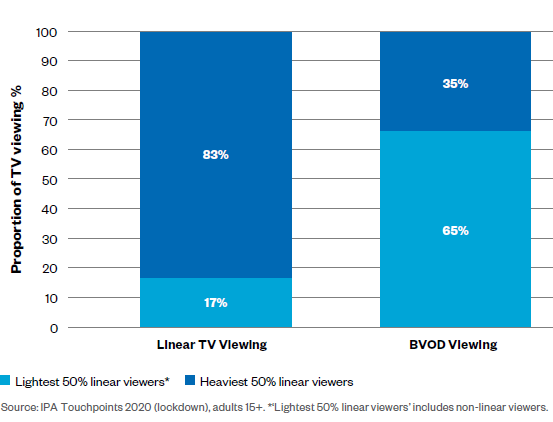
Many DRTV advertisers have traditionally shunned BVOD as it commands higher media CPT’s, but that’s penny wise and pound foolish. The metric to consider is not pure CPT, but cost per incremental cover point. Cost per incremental cover point in the 70% to 80% decile is typically ten times that of the first decile, meaning BVOD can deliver reach at a significant discount, and thus a lower Cost per Customer.
So, our advice may at first seem counterintuitive: In a time of rising (relative to last year, not the year before, yet) prices, try paying more. If you have a reasonable DRTV budget and are struggling to get growth, or just want more response, try adding BVOD to your schedule. Yes, you will pay higher CPT’s, but lower CPICP, and almost certainly lower CPA’s. To find out more, get in touch.