2020 was a grim year for many Fundraising Directors. Tales of income shortfalls, furloughs, restructuring abound, with NPC even creating a timeline to record the scale of redundancies in the profession. Yet, there seems to be a wide variety of performance when looking at the outcomes from last year. We know of several charities that didn’t just survive but thrived, and one that more than doubled its number of new regular givers recruited in 2020 compared with 2019.
This note asks why so many charities saw a shortfall in income; whether donors have consciously abandoned charities; and how charities might use this insight to drive growth in income from new and current supporters in 2021.
The accepted wisdom is that 2020 saw fundraising income fall
The truth is probably more nuanced because as yet, there is no complete market data set for 2020. In the absence of that, and publicly available data from Charity Financials or CAF, we have turned to survey data. Figure one below is typical of the claimed 2020 fundraising performance we have found.
This survey of 248 charities in January 2021 found that 48% of them reported that their income fell in 2020 vs 2019, with just 23% reporting growth. In earlier surveys PBE found that 70% of charities expected this shortfall in income to last at least throughout 2021.
Figure one: 48% of charities reported income falling year on year
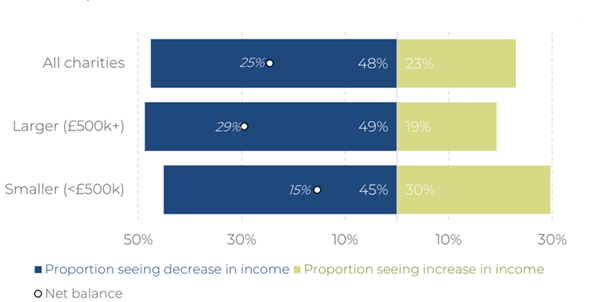
Source: Pro Bono Economics January 2021
To discover if UK consumers are actually giving less, and if so why, how, and what actionable insights we could create for charities who want to grow their income in 2021, we started by comparing those who gave to any charity in January 2021 with those who had done so the same month a year ago.
Please note, we have used a YouGov data set for much of this note, as it allows us to anonymise organisations, and not to break client confidentiality by using their data. However, the findings we report have also been seen across our client roster.
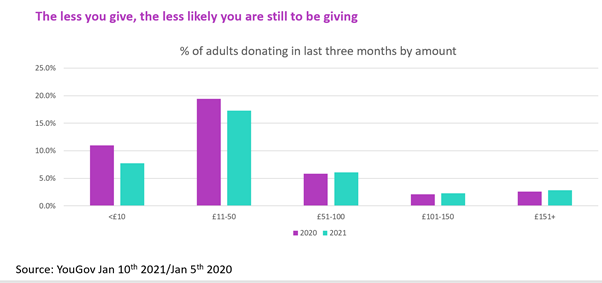
Figure two below shows the % of UK adults who gave varying amounts in the three months ending January 2020 and January 2021, respectively. We found that the number of people giving £50 or more (to all charities in aggregate) during this period (likely to be regular supporters or higher value cash donors) actually increased. The decline in participation came from those who gave less than £50 in the key Christmas period each year.
Figure two: Committed donors are still giving- many casual supporters have fallen out of the market
This claimed behaviour runs true with the experience of all of our clients this Christmas just past who saw their appeals to warm supporters produce record results. So, can we find any other evidence that suggests it’s the casual donor who has left the market?
We asked how donors had supported charities during early 2020 and 2021 and found number of giving cash down by about 1/3 year on year; those supporting by retail or sponsoring a friend declined by c40% and event participation down by 70%.
Figure three: direct debits and memberships have not really been impacted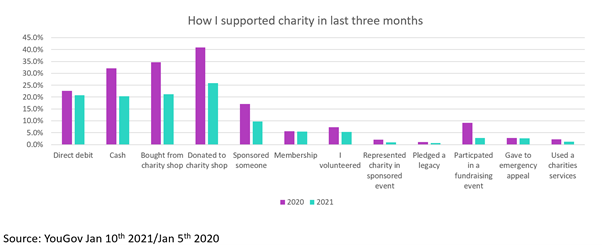
The key challenge here is that these supporters almost certainly aren’t on our databases. They truly are casual supporters, but for many of us they represent an awful lot of income. But is this just a 2020 effect or is likely to continue into 2021?
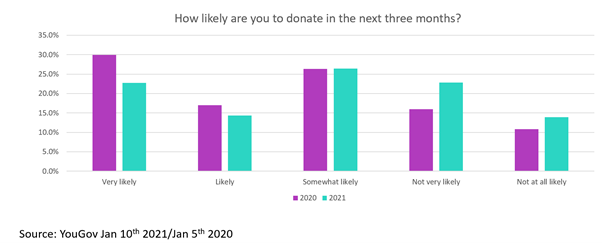
The bad news, seen in figure four below is that if anything the situation is likely to get worse, with some four million adults having moved from “very likely” to give in the next three months to “not very likely” to give in Q1 2021.
Figure four: the publics future giving intentions worried us
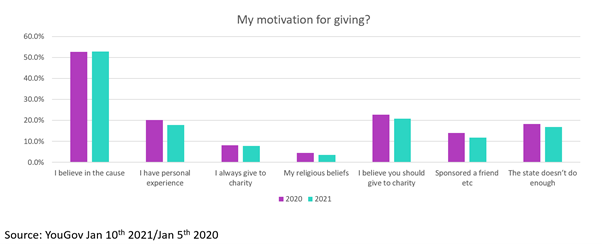
So, is this a deliberate rejection of charities? We were greatly relieved when we found the data contained in figure five below with essentially no significant changes in the number of those motivated to give to charity this year vs last. The majority of us who give, still do so because we believe in the specific cause; we believe we should give per se; or we have a personal connection with the charity.
Figure five: We are still motivated to give- the pandemic hasn’t changed that
Then relief turned to puzzlement. If we are still motivated to give, then why aren’t we giving?
We turned to commercial clients for an answer and found it in the retail sector. There we saw so called ‘multi-channel’ retailers (those with shops, catalogues, and E-commerce routes to market) not see a switch in sales from high street to their e-commerce and catalogue revenues in spring 2020.
By contrast, ‘pure play’ e-commerce retailer clients continued to grow. Reason being, the multi-channel clients were reliant on their high street presence creating saliency for them, and thus driving traffic to their websites. Just walking down a high street and passing a shop window would often prompt a subsequent visit to the website and a purchase.
We wondered if this might also be true for charities – were there pre-pandemic lots of casual encounters between supporters and organisation that weren’t paid for and weren’t measured, but like the retailers could have a big impact on revenues?
We set out to test this hypothesis by measuring the reach and frequency of all interactions UK adults claimed to have had with charities in Q4 2019 and again in Q4 2020; whether someone volunteered, baked a cake, visited a charity shop, watched a telethon, received an email / letter, or saw a TV ad.
We applied classic reach and frequency methodology to the claimed interactions driven by a combination of Owned (websites; organic social); Earned (PR); Shared (partnerships) and Paid media.
As figure six below shows the results were significant. In Q4 2020 charities interacted with 5.7 million fewer people than they did in Q4 2019.
Figure six: Charities interacted with 19% fewer people in Q4 2020 compared with Q4 2019
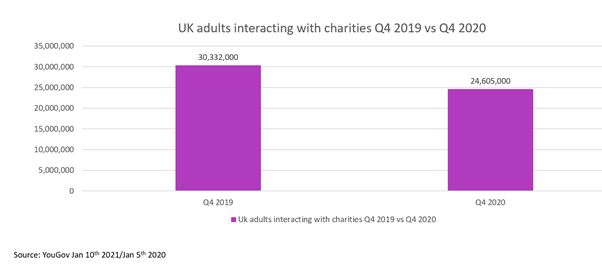
With the nationwide lockdown removing opportunities for shopping, participating in events, and discussions with work colleagues, charities weren’t present in the lives of nearly six million UK adults.
This is something we need to address, as charities are not that important to most of the UK population. To coin a phrase – they just aren’t that into us. To put this into perspective, in January this year 35% of UK adults resolved to get fitter and thinner in 2021, whereas only 5% of us resolved to give money to charity or to fundraise on a charity’s behalf.
Our second hypothesis was that, just like the retailers, if we could replace the missing interactions, or create saliency, we would see a return of the lost income. Supporters haven’t fallen out of love with us, they have just forgotten us.
We tested this hypothesis by identifying the ten charities who had gained the most current donors (according to YouGov) and the ten who had lost the most donors Q4 2020 vs Q4 2019. We examined whether they had lost saliency by measuring the change in brand searches on Google, and if they had taken any action to drive saliency up by investing in media.
There was a significant difference between the top and bottom ten. The top ten charities gained donors (albeit only a 1% gain but remember these are ALL supporters, not just those on the database). The bottom ten performers lost 42% of their supporters in the same period.
Figure seven: The top ten gained donors, held search interest steady, and invested in media in 2020
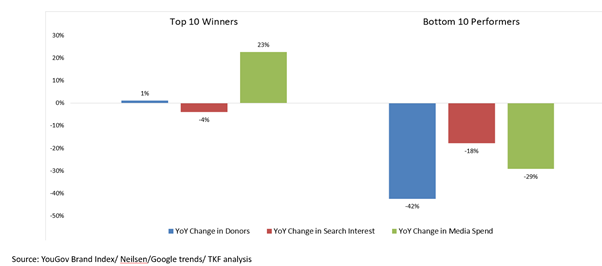
The data in the chart above supports our hypothesis. The top ten performers all spent more on paid media, effectively replacing the Earned, Owned or Shared interactions that supported saliency for the organisations a year ago in a different life. The bottom ten all cut spend, compounding the loss of interaction caused by the pandemic, and causing saliency and thus search volumes to fall. And as rule 101 of fundraising says, ‘you don’t ask, you don’t get’.
We had rather expected this result, however are slightly concerned that you’d expect us to suggest that a way to cure all ills is to spend more on media. So, we checked to see if there were any other characteristics of successful fundraisers in 2020 and we found two – one tactical and one strategic.
One straightforward tactical lever you can pull is lowering the barriers to giving to you. As mentioned above, the donors lost are casual donors – those who don’t have to make much of an effort to give. They take the easy route of coming into shops or sponsoring a friend or baking a cake. Many organisations didn’t replace these easy-to-engage products with other easy, low barrier products. Those who did, gained.
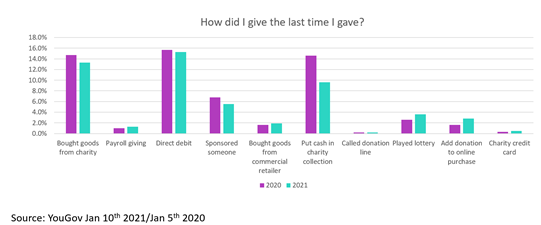
We illustrate this point with one final chart from YouGov and claimed giving by product type. As observed before (and in real life), direct debit numbers have remained steady year on year. Cash donors (remember this all cash – including buckets and anonymous) have fallen. The numbers playing lotteries and giving by adding a small amount to an online purchase have both grown.
These two products reflect the bored at home, online reality of 2020. And they are the equivalent of a casual date and not a long-term commitment – just what the casual supporters who have left the marketplace need.
Figure eight: New opportunities that reflect the way we have lived in 2020 have attracted new donors
Using behavioural economics to identify or create products that lower the barriers to giving to us, and meet the needs of casual supporters, will be a key tactical tool for 2021, and maybe beyond.
The last lever you can pull for growth is a strategic one. It’s not an easy tactical route to income in the next quarter like the previous two, but it is a powerful lever for long term, sustainable growth and competitive advantage.
As we observed in figure two some pages back, the donors that have stopped giving are the casual ones. That means that those who are still giving are the committed ones. We also saw in figure five above, that ‘belief in cause’ is the single biggest motivator for giving.
While our tactical goal could be to replace the casual donors (a valid goal given they give a lot of money), our strategic goal should be to create more donors who believe in us. Now that’s a qualitative judgement, or a brand value, dependent upon which team you work in.
Fundraisers espouse observed behaviour like ‘did you click’ or ‘did you give’ rather than a soft ‘do you care”. So, we offer one hard behavioural metric that correlates with belief, and that we know drives income.
Figure nine below shows, for a TKF client, the correlation between belief and income, and advocacy and income.
Figure nine: For a successful 2020 organisation belief in cause correlates with advocacy and income
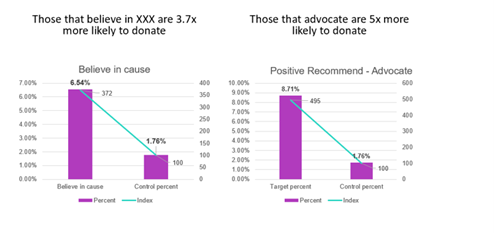
As you would expect, adults who say they believe in this charity are nearly four times more likely to give to them than all adults. So far, so brand metrics. What we also found is that adults who advocate on this charity’s behalf are five times more likely to give than the average adult. And yes, advocacy behaviour does correlate with belief, separately. In these days of social listening and tag tracking, we can monitor those “speaking” on an organisation’s behalf. And we have found that those who care enough to speak and are close enough to the cause to understand what to speak about, are also very valuable in cash terms.
This relationship doesn’t happen by accident. Something in that supporter’s life has driven them to engage with the cause, discover more about it, and then make the effort to speak to others about it.
We have developed a toolkit and measurement framework than can help organisations create this closeness with the ambition of becoming the cause that a supporter group love above all others.
It’s not a quick tactical win. It’s a longer strategic journey, but organisations that have been on it have proven strong and have grown in 2020.